Lean PPM – step 16: Prioritization at Digitec Galaxus AG – a real world example for calculating Cost of Delay
Just to remind you on my last blog: At Digitec Galaxus we decided to adopt the weighted shortest job first (WSJF) approach for prioritization of initiatives. The reasons we decided for the WSJF approach are as following:
- The executive members of the responsible decision board prioritize based on the mindset “What are the items to be delayed for realization so that we can work with high focus on the items we will lose to highest amount of profit, if WE DO NOT implement them. This mindset supports and fosters our Kanban based pull system.
- A transparent, easy to understand and use prioritization approach supports the communication of prioritization. The often mentioned gap between top management and development teams can be closed as decision are more structured and fact based instead of based on gut feeling and common sense.
The principles of WSJF are defined in the scaled agile framework SAFE or in the book The Principles of Product Development Flow by Donald G. Reinersten (ISBN-13: 978-1935401001, http://www.leanproductflow.com/) as following:
WSJF = Cost of Delay / duration, with
- Cost of Delay (CoD) = Business Value + Time Criticality Factor + Risk Reduction – Opportunity Enablement.
- Duration as the proposed time period required to implement and deploy a feature to operational state.
The Problem of quantifying Cost of Delay
The right side of the Cost of Delay formula is somewhat weak. Reasons is: the factors on the right that are hard to quantify. In literature only a few examples or case studies are available at all – and if so, these examples often require measurements on a very detailed level and a very standardized production process as prerequisite that is neither lean nor applicable in a fast changing and customer driven ecosystem.
Based on these somewhat dis-motivating background we at Digitec Galaxus AG decided to define the CoD factors in our very own context. We decided to calculate Cost of Delay on a set of concrete, normalized and quantified factors that implement the idea of Business Value, Time Criticality, Risk Reduction and Opportunity Enablement. The factors shall represent our business context as e-commerce company in a consumer and market driven environment.
This blog presents our solution to calculate CoD in our very specific context. It is important to understand that our solution works only in our context and not in your context. The reason I describe the solution in detail is my offering an support that you might develop your own creative ideas how to design your CoD definition.
Our design background for a Cost of Delay definition
It is important to understand what conceptual ideas we respected in our CoD design. Our first step was to identify the factors that express Business Value, Time Criticality Factor, Risk Reduction and Opportunity Enablement in our context.
Luckily we already had a good source to populate these factors. The source is the implementation of our Lean Balanced Score Card (LBSC). On top level of Digitec Galaxus we observe our company performance based on a Lean Balanced Score Card with KPI’s on all four perspectives as there are: 1. Financial perspective; 2. Customer perspective; 3. Potential (or learning and growth perspective); and 4. Internal business processes perspective. The KPI’s in this Lean Balanced Score Card are a very good base to select an as balanced set of factors in our CoD calculation. This approach confirms the alignment of our company strategy.
It is important to understand that the Lean Balanced Score Card for sure targets another goal than the CoD definition for prioritization. In our Lean Balanced Score Card are about five to eight KPI’s per perspective. Each KPI has a clear measurement behind that is maintained and implemented by our business intelligence team. Nevertheless, if the factors in our CoD definition would represent a different strategy than our benchmarks in our Lean Balanced Score Card, our internal alignment just would be wrong.
Another conceptual idea was to normalize each factor in our CoD definition on a scale between 1 and 10. The normalization gives us the chance to level changes in our company development. For example, given the fact that we luckily could double our turnover and one of our CoD factors is growth in turnover, we can justify the growth by mapping larger values in turnover to the normalized numbers between 1 and 10.
The third conceptual idea is that a calculated CoD and WJSF number – whatever calculation scheme you use –shall express – at least in the overall direction – the average gut feeling for prioritization of the executive management. So we decided to run test rounds with calculation results. In a first round the business development tested the calculation. The test was easy: every member of the business development team set the factors for each initiative blind. We then compared the results against each other and against the existing prioritization in our productive Kanban board if initiatives. In that way we came to a common interpretation of the factors and their weights.
The second round of test was the real live usage. We just deployed the WSJF number visible in our Kanban board of initiatives and right away started working with this new feature with the executive team and all stakeholders. We challenged the executive management to set the factors and to reflect the results against their gut feeling prioritization.
In our world of Digitec Galaxus AG we often just deploy a new (small or even larger) feature or process change and start working with it right away. Changes are welcome and in most (not in all!) cases not seen as thread. Our staff members from executive team down to the normal worker are used to that and give feedback right away. You just have to stand the feedback in case you deployed crap…
Finally, we redefined the factors, the normalization and the weight factors in the algorithm several times until we confirmed ourselves that the identified formula represents our strategy and proves to be a helpful instrument in prioritization.
The Digitec Galaxus approach to quantify Cost of Delay
Let’s get to the point. The final formula for CoD uses the following influencing six factors:
- Strategic alignment: the degree this feature supports our strategy as expressed by our strategic roadmap.
- Potential for increase of turnover: I guess this is self-explanatory
- Potential for cost saving or increase of efficiency: Cost saving features typically are automation of steps in business processes like invoicing or order management.
- Competitive advantage: This factor is our benchmark against our competition. For example, we set a 10 for a feature that represent an USP customer feature that is totally new in e-commerce.
- Loss of value over time: Often features do have an impact on the market only if operative within a certain time window, the window of opportunity. This is a very important factor for market driven companies. A feature may have only a very small window of opportunity requiring to implement it very fast.
- Increase of capabilities: this factor respects our learning and growth. We do have initiatives in our Kanban board that address solely learning aspects. For example, right now an initiative strives to improve our acceptance testing framework and the quality of our automated acceptance test suite. This includes as well training and coaching measures.
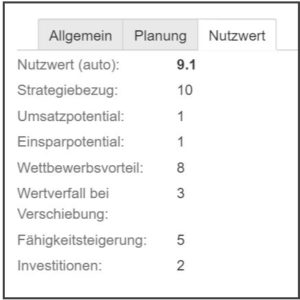
Business Value Settings implemented in Jira
I mentioned above that we normalize all factors on a scale from one to ten. This requires to map a value on the one to ten scale to a clear status change or measurable quantity in the real world. The benefit of normalization is that a. The results are relative therefore easier to rank and b. the algorithm behind the Cost of Delay is more stable.
I want to demonstrate the way to normalize on two factors: Strategic alignment and competitive advantage. We normalized these factors as following:
- Strategic alignment: As I reported in a previous blog about the implementation of our strategic roadmap, the physical representation of our strategic roadmap is an eight-meter-long wall of sticky notes following the ideas of Jeff Pattons story mapping approach see (see Jeff Patton’s blog about story mapping). The normalization then is easy:
- If the item to prioritize represents one to one a sticky note on the strategic roadmap, the item is mapped to a 10.
- If the item to prioritize is related to or supports a sticky note on the strategic roadmap, the item is mapped anything between 4 to 7.
- If the item to prioritize cannot be related to any sticky note on the strategic roadmap, the item is mapped to a 1.
- Competitive advantage: The benchmark of competitive advantage are the features offered to customers either by our company or by our direct competitors. We use this benchmark of features as base for normalization
- If the item to prioritize implements a clear USP feature, the item is mapped to a 10.
- If the item to prioritize implements or improves a core feature or a required base feature that helps us to excel our competition, but it is not an USP of our service offering, we map the item to a 4 to 7.
- If the item to prioritize implements a me-too feature not seen as required base feature, we map the item to 1.
The point in these mapping schemata for every single factor is that we have gone through a vital discussion what we interpret as a 1, 4, 7 or 10. We describe these mapping with very clear and measurable benchmarks or quantify the mapping. For example, the mapping of factor “potential for increase of turnover” is quantified in Swiss Francs. The discussions and the feedback back rounds in the mapping the definitions resulted in an overall accepted and understood interpretation of the factors.
Now we reached the point that we were able to set the single factors that influence the calculation algorithm. Next step is to specify the calculation algorithm. As we are currently following a growth strategy, we consequently have to weight turnover and competitiveness higher than cost saving. The calculation formula respects this by setting the weights of the factors accordingly.
In concrete our algorithm is as following:
Cost of Delay = 0.6 * strategic alignment +
0.6 * potential for increase of turnover +
0.4 * potential for cost saving or increase of efficiency +
0.4 * competitive advantage +
loss of value over time +
increase of capabilities.
As every single factor in the algorithm is a number between 1 and 10, the Cost of Delay value is in a range from 4 to 40, with the lowest Cost of Delay as a 4, the highest Cost of Delay as a 40, i.e. there is a multitude of ten between the lowest and the highest number for Cost of Delay.
The final step in our calculation is the WSJF value. As we normalize the quotient “Duration” in the WSJF formula as well on the scale between 1 to 10 the WSJF value results in a number between 0.4 to 40.
This approach is unique for Digitec Galaxus
Dear reader, please be aware that this concrete solution for calculating WSJF numbers is valid only in the context of Digitec Galaxus.
So what is your take away? What are good practices that can be transferred into a different context?
From my personal point of view the transferable learnings are:
- The WSJF approach improved our prioritization system by making business value and other influencing factors transparent
- Align your factors with your strategy. A Balanced Score Card – used in a lean way – could be used as starting point. The weights of the factors in your WSJF algorithm have to reflect your strategy as well.
- The most important activity in specifying the WSJF algorithm is the discussion about the influencing factors AND the benchmarks used to quantify a factor.
- If the WJSF results and your gut feeling about the results differ, you have to step back and go through a next round. Gut feeling is not the worst way to prioritize. The factors in the algorithm are nothing else then making gut feeling transparent and understood by others.
- Normalization of factors supports a more stable algorithm compared to absolute factors.
There are more findings and benefits we discovered after establishing the prioritization system based on WSJF for quite a while – but this is subject of my next blog.
Summary of this blog
As examples and good practices in literature and on the web are rare, we decided to define Cost of Delay at Digitec Galaxus AG based on normalized and quantified factors that represent the components in a Cost of Delay calculation.
We specified the calculation algorithm for Cost of Delay and WSJF based on feedback of prioritization experiments done by experts in our company and aligned to our company strategy.
The result of the WSJF calculation for an item to prioritization is a number between 0.4 and 40. Higher numbers represent higher priority. The absolute number itself does not say anything about priority of an item. The number are relevant only in a relative comparison of items against each other.
Never ever rank items in your portfolio strictly based on the results of any WSJF calculation algorithm. The results shall be used as one information unit out of a set of information units that influence the prioritization of an items in your portfolio against other items.
And to keep you curious 😉 I will address somewhat unexpected positive results of the WSJF prioritization schema in my next blog.
 Next Post
This is a great and thoughtful extended implementation of WSJF! Thanks to Rainer and his team from Galaxus. You will find this also as an optional approach to WSJF in Applied SAFe. Our thanks go to Rainer & Galaxus which allows us to implement this for public use in our product.
Excellent blog! Do you have any suggestions for aspiring writers?
I’m hoping to start my own blog soon but I’m a little lost on everything.
Would you advise starting with a free platform like WordPress or go
for a paid option? There are so many choices out there that I’m totally overwhelmed ..
Any recommendations? Kudos!
Dear Verona (?)
I can recommend WordPress as platform. I do not know many other platforms, but with wordpress it is pretty easy to build your own site.
If you try wordpress I recommend to play with different themes. different themes support different layout options, so you can see what supports best the way to represent your site.
As soon as you decided for a theme I recommend as well to stick as close to the options the theme offers and stay away from customizing and programming the theme.
Additionally there are many plugins to enhance your site with additional functionality. But many plugins are somewhat crude, so testing different plugins for a specific feature is a wise strategy.
When you found you theme and a set of plugins that satisfy your needs it might cost some money as well. I personally decided then to buy the full vesions of the theme and plugins. the free version often support only a minimal set of features. The full version clearly then enhance your site.
I recommend especially the askimet anti-spam plugin to clear your site from spam comments 😉
I hope that answer is of value
Best Rainer